Portfolio Overview
Properties
26
Portfolio Property Value1
US$18.4 billion
S$24.5 billion
Steady Operating Metrics YoY
Portfolio Committed
Occupancy2
Occupancy2
97.3%
1.5 ppts
Portfolio
Property Value
Property Value
S$24.5
billion
billion
1.2%
Portfolio
Property Value
Property Value
3.4 years
0.3 years
FY 2023
Rent Reversion3
Rent Reversion3
Retail Portfolio
8.5%
Office Portfolio
9.0%
Retail Portfolio
FY 2023
FY 2023
Tenant Sales4
1.8%
Shopper Traffic5
8.6%
Occupancy
Cost
Cost
16.3%
0.3 ppts
Retail Portfolio Information
Retail Occupancy Rate2,6
98.5%
Retail Weighted Average Lease to Expiry6,7
2.0 Years
Office Portfolio Information
Office Occupancy Rate6
96.7%
Office Weighted Average Lease Expiry6,7
3.4 Years
Integrated Development Portfolio Information
Integrated Development
Occupancy rate
Occupancy rate
98.5%
Integrated Development Weighted Average
Lease to Expiry7
Lease to Expiry7
4.9 Years
Notes:
1
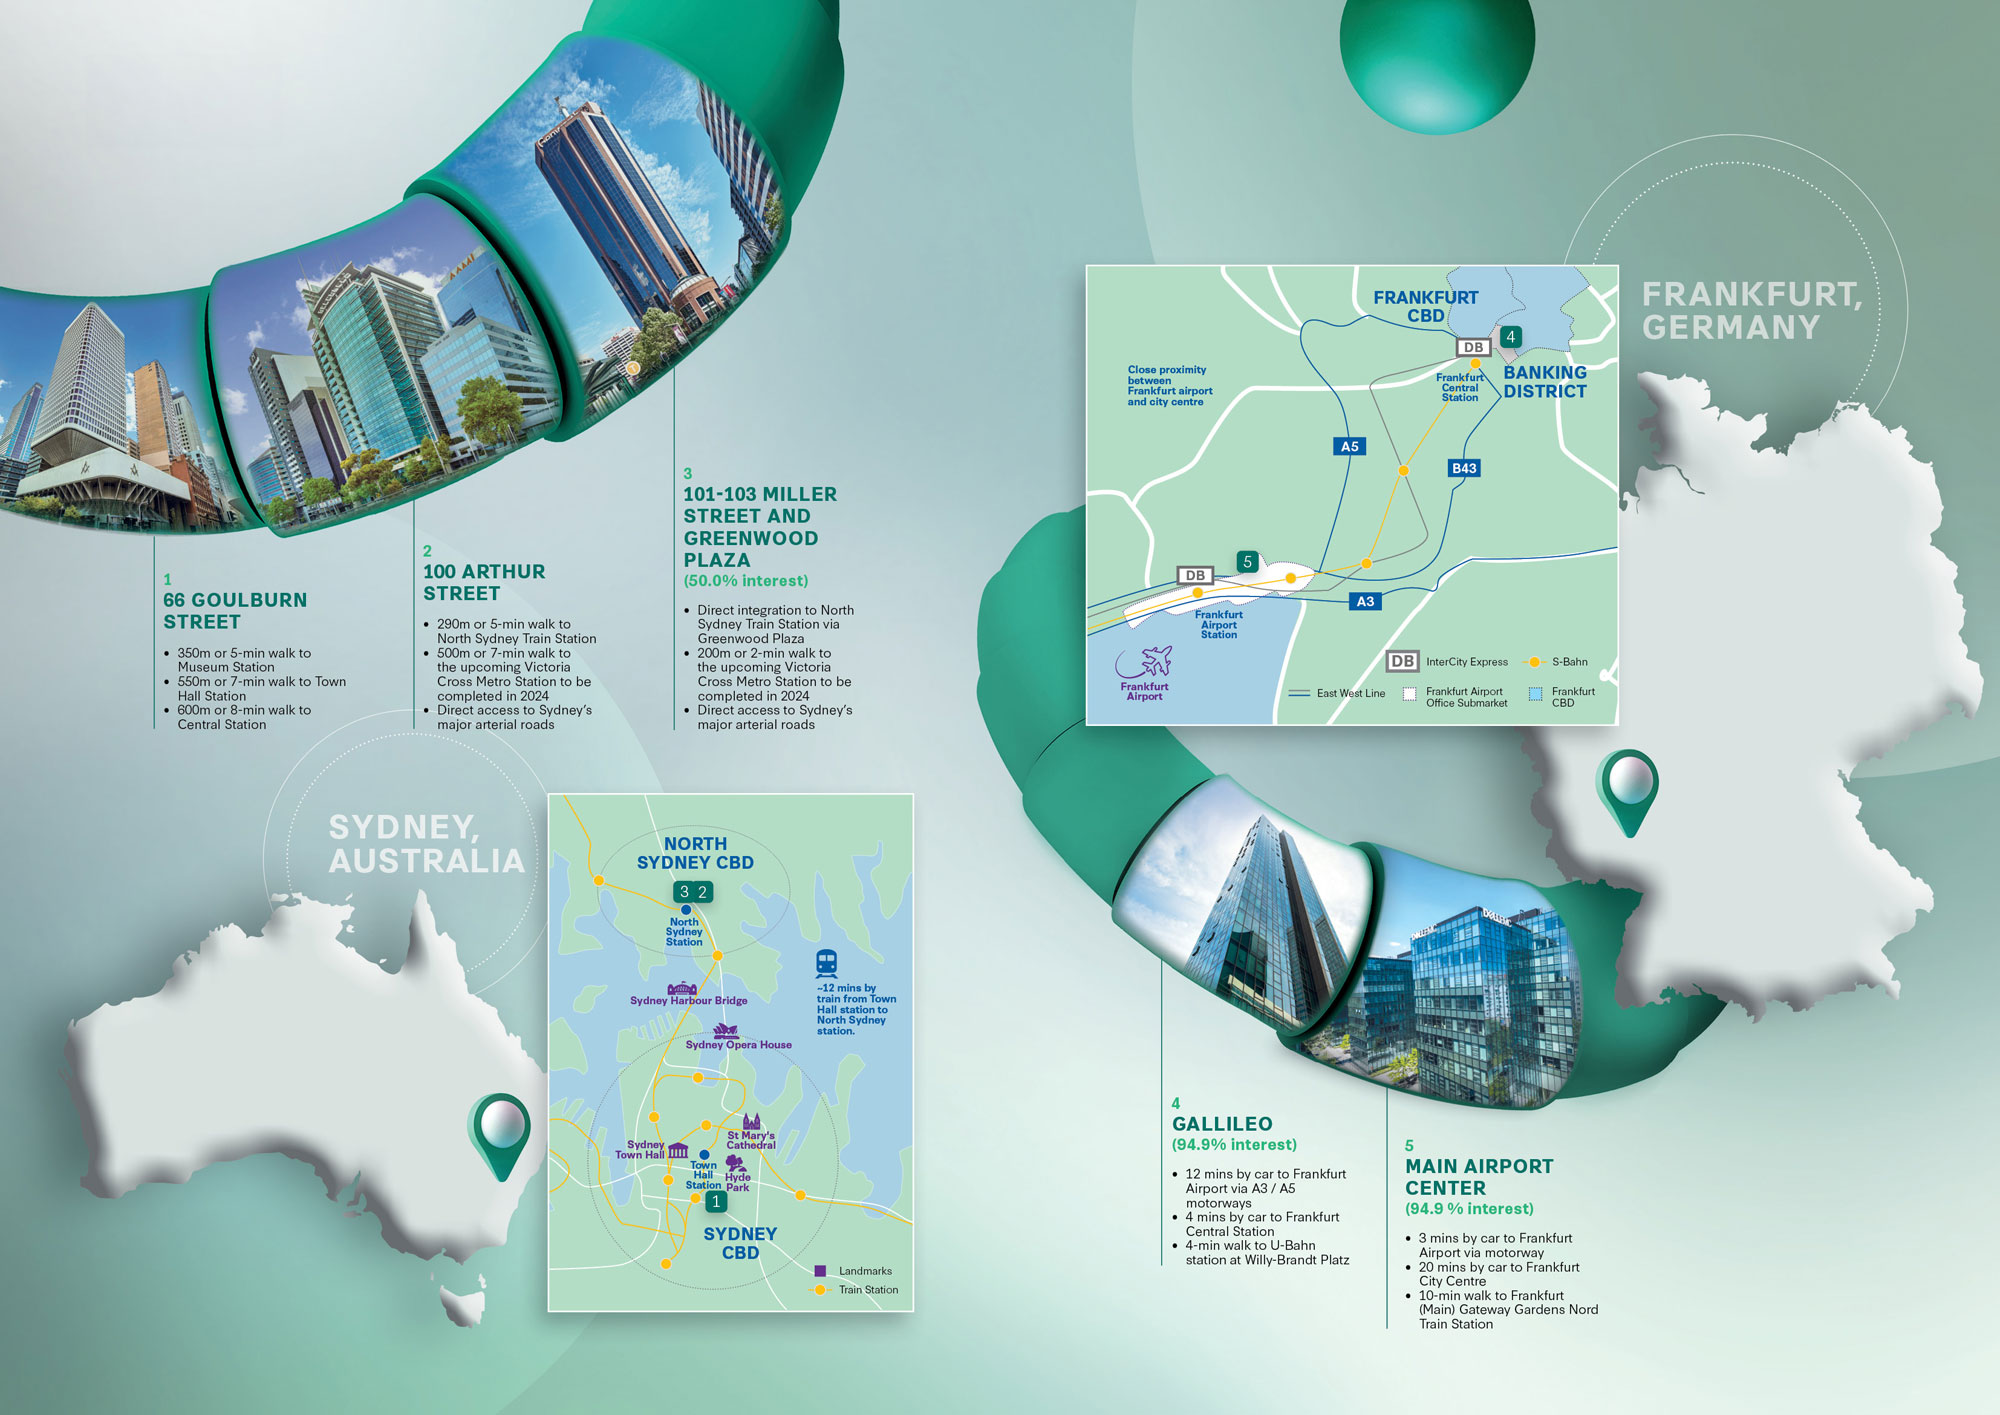
Portfolio property value as at 31 December 2023. Includes CICT’s proportionate interest in Gallileo and Main Airport Center (94.9% respectively), CapitaSky (70.0%), CapitaSpring (45.0%) and 101-103 Miller Street & Greenwood Plaza (50.0%).
2
Includes CQ @ Clarke Quay as major AEI works have been completed.
3
Based on average committed rents for incoming leases versus average rents of expiring leases of Singapore portfolio.
4
Compared against FY 2022 tenant sales on a per square foot (psf ) basis and adjusted for non-trading days.
5
Compared against FY 2022 shopper traffic.
6
Retail comprises retail-only properties and the retail component in integrated developments (except Greenwood Plaza which is a small retail component) and office comprises office-only properties and the office component in integrated developments.
7
WALE is based on monthly gross rental income and excludes gross turnover rents as at 31 December 2023.
SINGAPORE
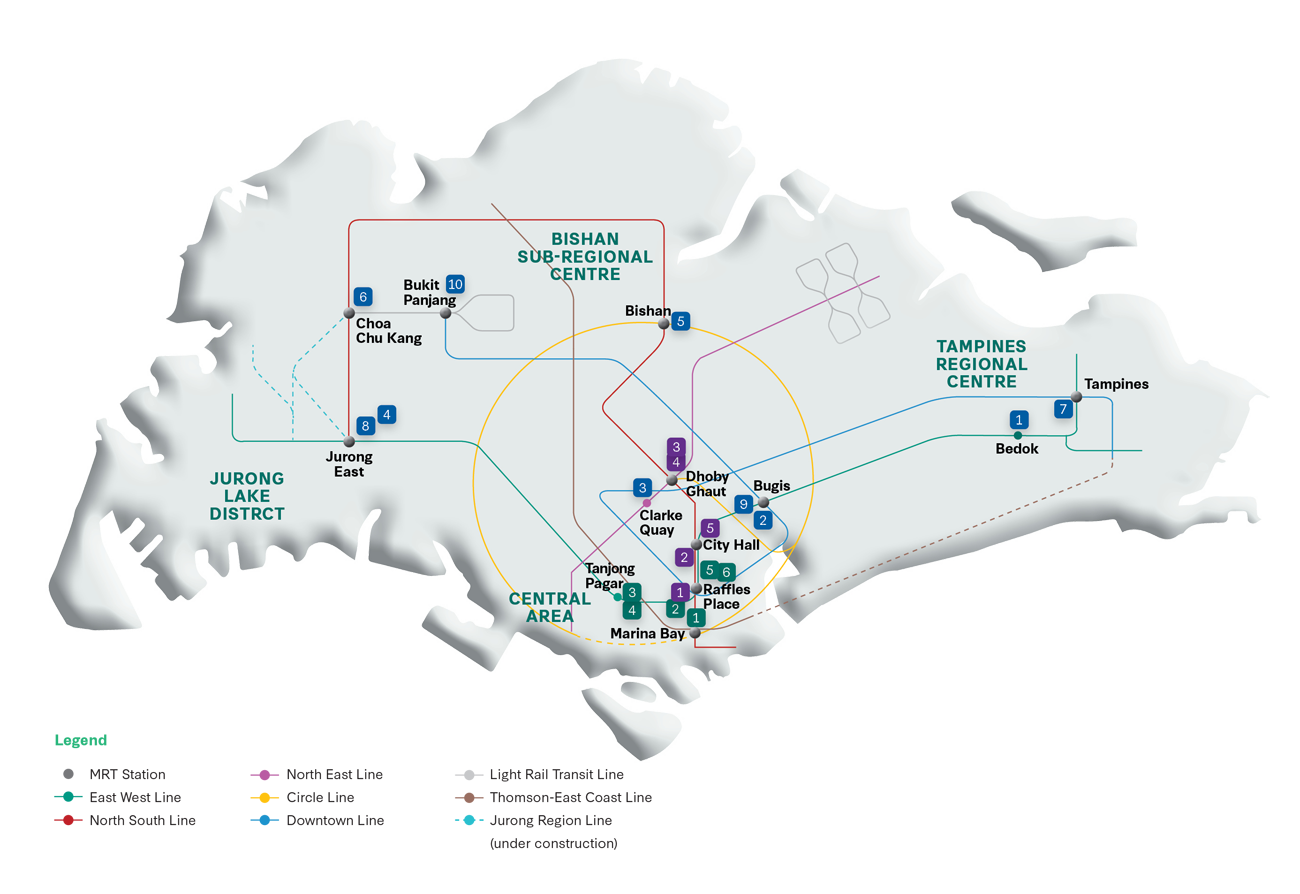
Integrated Developments
2
Office
Retail
OVERSEAS PROPERTIES